Back
to Top

SSAVE - Documentation

Introduction

  • Item Name : Sleep Period and Spectrogram Analysis and Visualization for Electroencephalography Data (SSAVE)
  • Item Version : v 1.0
  • Author : Amlan Talukder

SSAVE is designed to extract, customize and visualize sleep periods from EEG data. This documentation is to walk users through the both the web and desktop versions of the tool.


Desktop version

The desktop version of SSAVE can be downloaded from here. In order to use the desktop version, you will need to install the following tools and packages.

  1. 1. Install python 3.6 or higher
  2. 2. Install the following python packages: numpy, matplotlib, mne

User interface

The user interface (UI) of SSAVE is similar for both web and desktop versions. The home page UI has three main panels:

  1. Input panel: Takes user input.
  2. User notification panel: Notifies the user with messages.
  3. Output panel: Shows the outputs.

Inputs and Outputs


Inputs

SSAVE takes two types of input files.

  1. 1. EEG sleep data in EDF format.
  2. 2. Epoch wise sleep stages in text format. This file must have at least two columns. The first column will contain the epoch number and the second column will contain the sleep stage labels assigned to that epoch according to following criteria, "W" for Wake stage, "N1" for N1 stage, "N2" for N2 stage, "N3" for N3 stage and "R" for REM stage.

Outputs

SSAVE generates following outputs.

  1. 1. An image file for the visualization in JPEG format. The plot shows the sleep periods, sleep stages and spectrogram. If the input file is the epoch wise sleep stages, the plot will not show the spectrogram.
  2. 2. Epoch wise sleep periods in text format. The file has three columns: epoch number, index for sleep period and sleep period name (NREMP or REMP).
  3. 3. Epoch wise sleep stages in text format. The file has two column: epoch number and sleep stage.

Process Data


Loading Data

After selecting the input file the user needs to click the "Load" button to load the sleep data. When the data is loaded the "Configure" and "Execute" buttons will be enabled.


Execution

The execution of SSAVE begins after clicking the "Execute" button. Once the execution is done, the user can see the resulted visualization and the extracted sleep periods and stages in the the two tabs of the output panel. The user interface panel will notify users with useful messages at every step.

The output files can be downloaded as a zipped folder by clicking the "Download" button at the top right corner of the output panel.


Spliting long NREM period

Sometimes an NREM sleep period can be too long to be considered as a single period. In that case, the long NREM sleep cyle can be split into two NREM periods. SSAVE applies rules to determine the epoch numbers where a long NREM can be split. If it can find these splitting options, another tab named "NREM cut points" will be shown on the output panel. This panel will present the possible epoch numbers options to cut a long NREM period. User can select the cut point options and click execute to apply them on the output. The spectrogram is also shown in this tab to help user determine the cut options.

Change Configuration


User can change the configuration of the sleep data processing by clicking the "Configure" button at home page. The configure option is enabled only for when the input file type is "EDF File".

Clicking the "Configure" button will take the user to the settings page in a new window. This page contains four tabs: Select Channels, Select Sleep Stage Events, Set Filters and Set Epoch Size. Any changes in this page can be saved by clicking the "Save" button at the bottom the page.


Select Channels [Back to top]

The EDF file of the sleep data contains channels of several types such as EEG channels, EMG channels, EOG channels etc. In the "Select Channels" tab, all the available EEG channels from the input EDF file are shown. The following EEG channels are selected by default: F3, F4, C3, C4, O1, O2, M1 and M2. User can change this configuration by selecting any channels of their liking. When processing data, SSAVE will consider the average of all the selected channels.


Select Sleep Stage Events [Back to top]

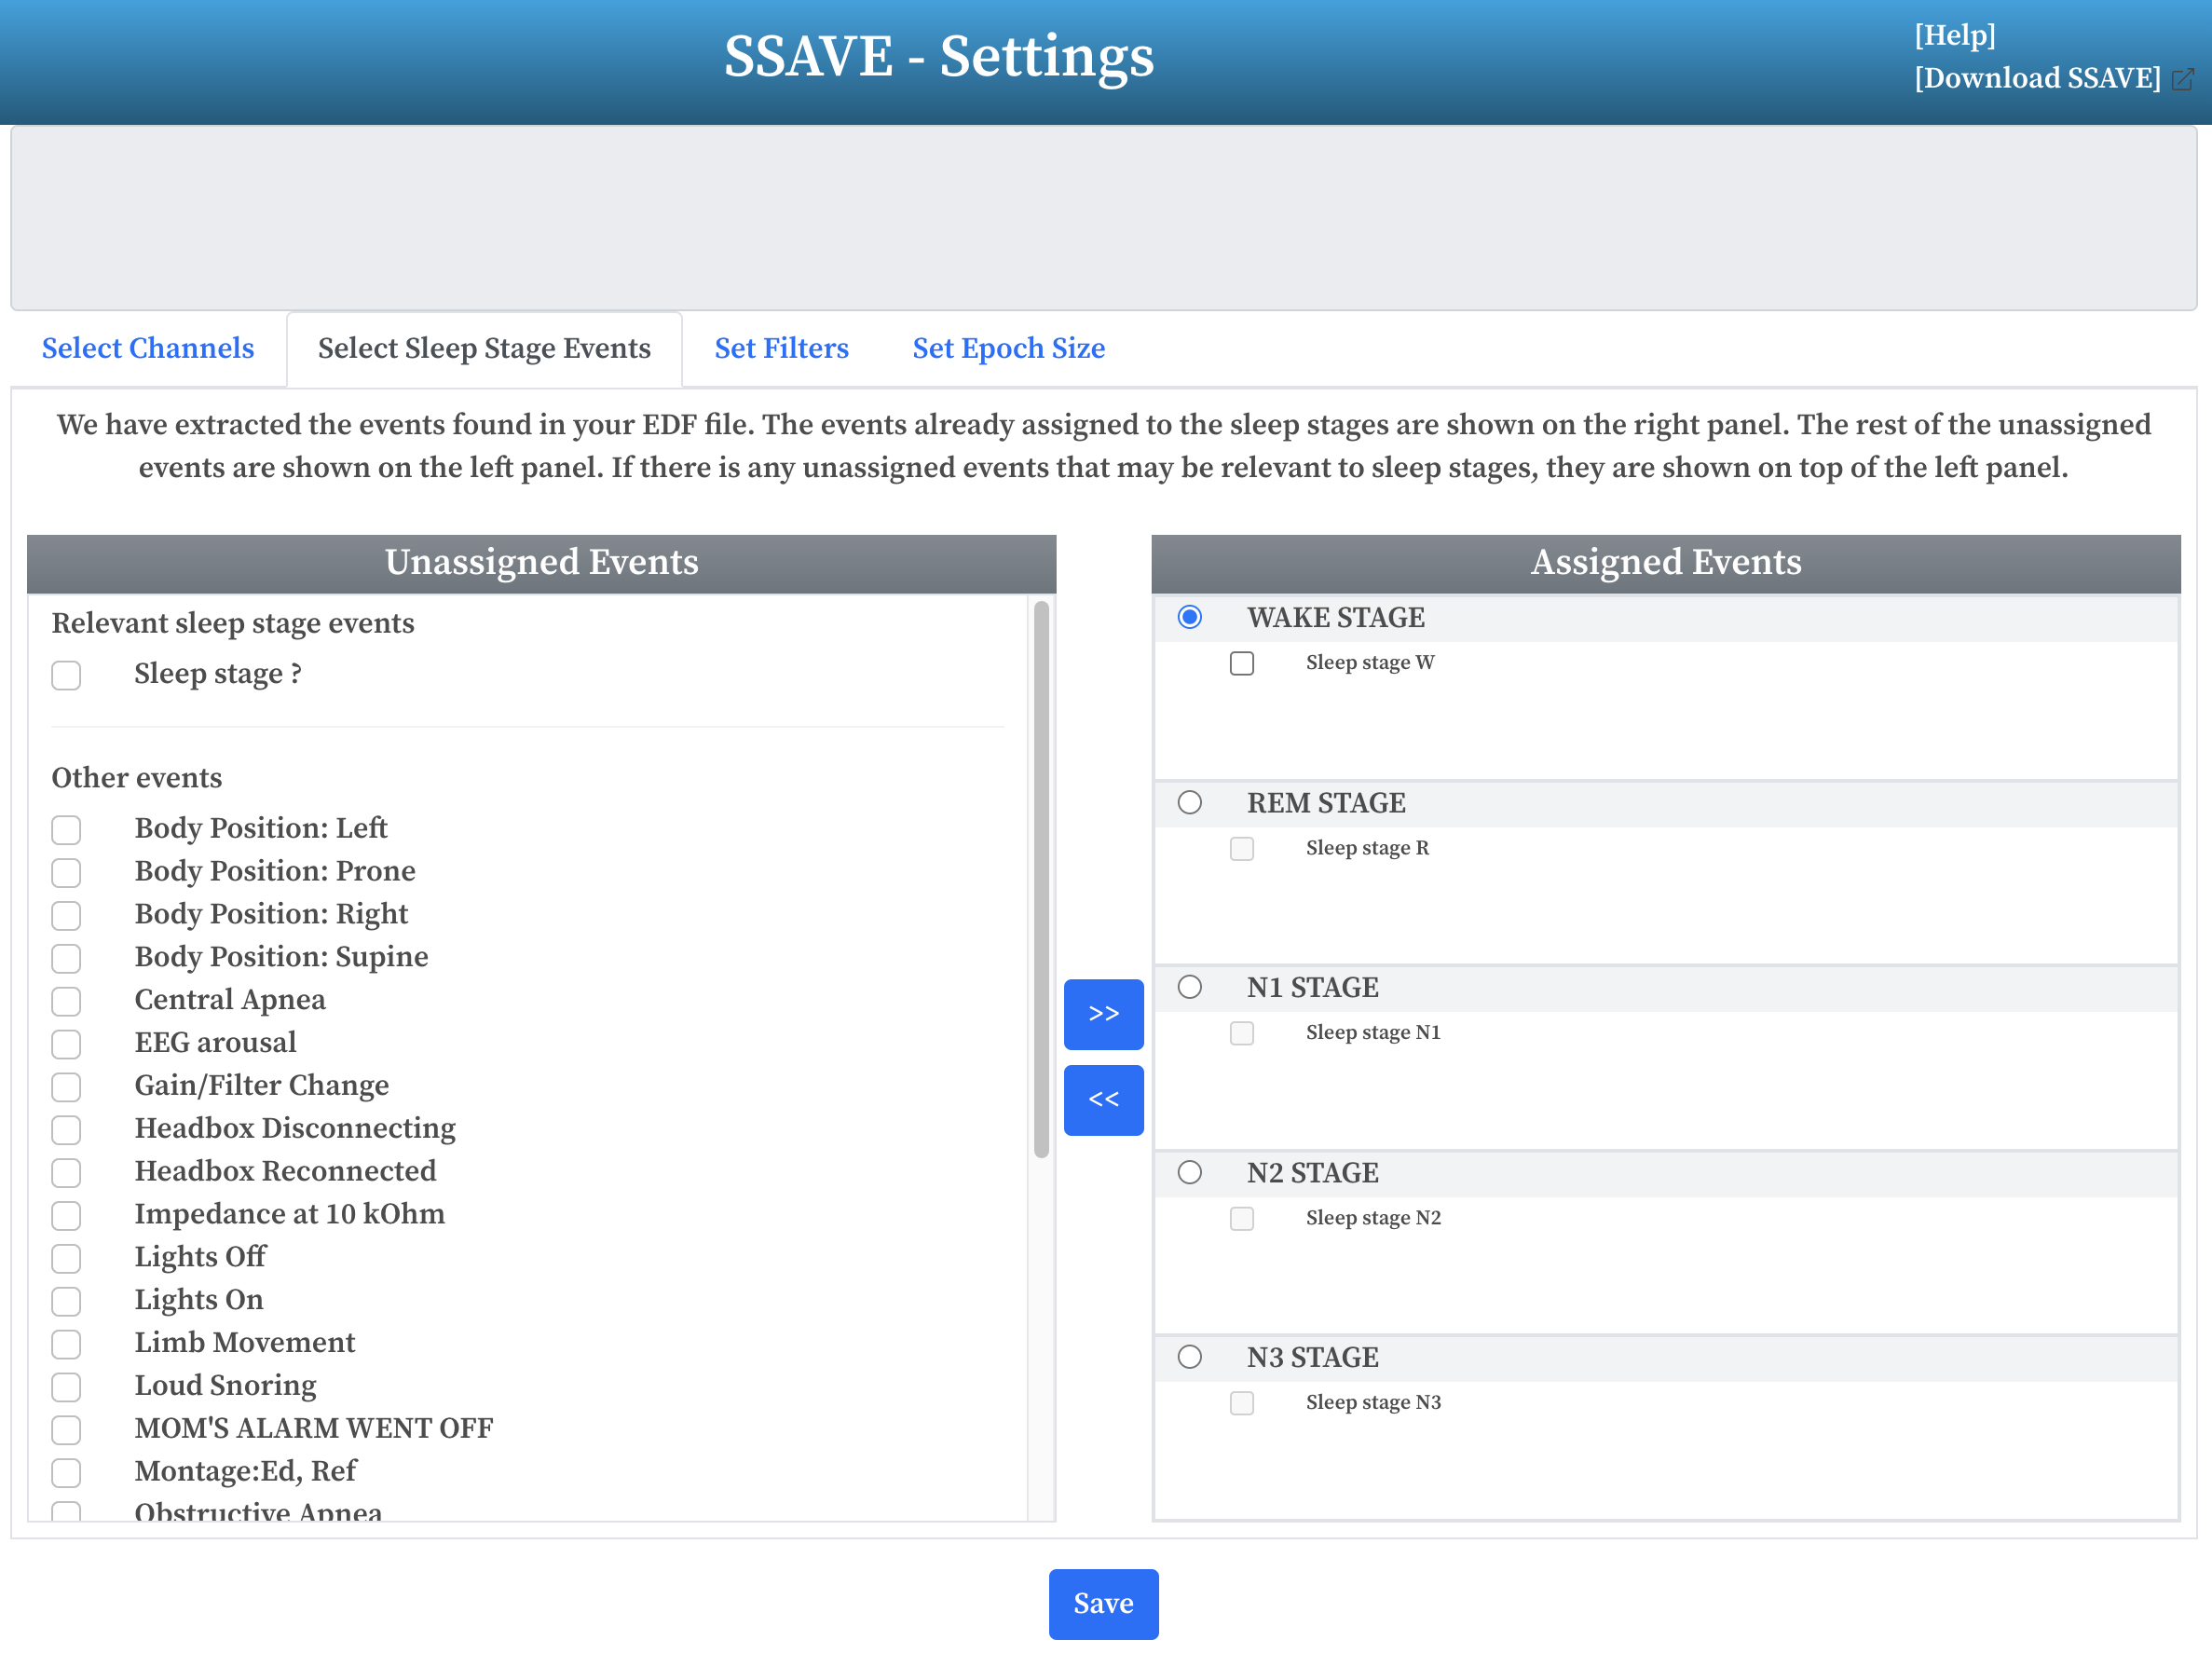
The EDF file associates particular events at different timestamps. The events assigned to a sleep stage help to annotate the corresponding timestamps of the EEG data to that sleep stage. These sleep stage events can vary across different labs. So, in this tab, the user is provided with the flexibility to select the events related to the five sleep stages.

This tab has two panels. The panel on the left side shows all the available events extracted from the input EDF file. The events that may relate to a sleep stage is showed on top under the header "Relevant sleep stage events". These events are chosen using any of the following keywords: 'sleep stage', 'wake stage', 'stage wake', 'w stage', 'stage w', 'wake', 'n1 stage', 'stage n1', 'nrem 1', 'n1', 'stage1', 'stage 1', 'n 1', 'n2 stage', 'stage n2', 'nrem 2', 'n2', 'stage2', 'stage 2', 'n 2', 'n3 stage', 'stage n3', 'nrem 3', 'n3', 'stage3', 'stage 3', 'n 3', 'rem', 'r stage', 'stage r'. If no relevant events can be found from the event list or if all the sleep stage related events are already assigned to the sleep stages, then the top header on the left side panel will show "No relevant sleep stage available for selection".

The panel on the right will show a menu to select a sleep stage and assign the events to the sleep stage from the left side panel. The table at the bottom of the right side panel will show the events that have been assigned to the five sleep stages.


Set Filters [Back to top]

This tab shows the frequency filters (notch filters and band pass filters) to apply on the EEG data. The notch filter frequecy value (default 60 Hz) help to reduce the line noise from the data. The band pass filters (default 0.05 Hz - 30 Hz) retains all the frequencies within the provided range.

Except the frequency filter the user can also filter out unwanted epochs such as epochs with flat signal for a certain duration and the epochs which associate with unimportant events from the data, such as, bathroom breaks, high movements.


Set Epoch Size [Back to top]

For EDF file with epoch window size different from 30 seconds, the user can change the epoch size.

Cite Us


Talukder A., Li Y., Yeung D., Umbach M.D., Zheng F., Li L. (2022) SSAVE: Sleep Period and Spectrogram Analysis and Visualization for Electroencephalography Data. Journal Volume(Issue) [pages]